How To: Create a Chart
Data charts must be assigned to a particular report.
To add a chart to a report:
In the Administration panel, go to Orders → Sales reports.
Click the gear button and choose Manage reports to show the list of all available reports.
Click the gear button of the required report and choose Edit from the drop-down list.
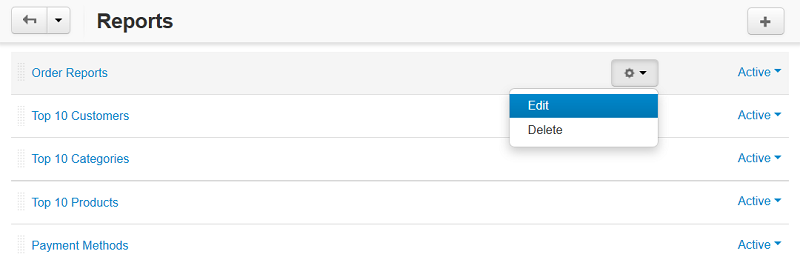
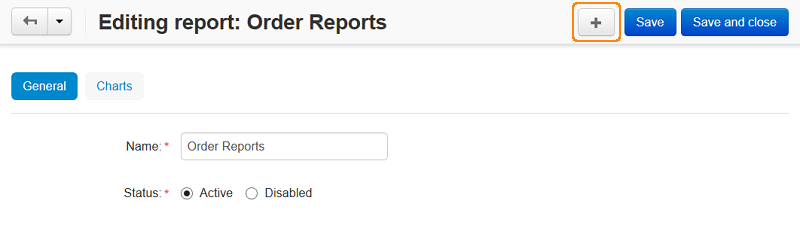
This will open the report editing page. The Charts tab contains a list of assigned charts.
Click the + button to open the chart creation form.
Fill in the form.
Use the General tab to define the chart scope:
- Name—the name of the chart as it will appear in the report.
- Position—the position of the chart relatively to the position of other charts in the report.
- Type—how the data should be represented: graphically or in a table.
- Object to analyze—the type of data to be reported on (users, orders and order statuses, products, categories, etc.)
- Value to display—the aspect to be analyzed.
- Time interval—the analyzed periods (day, week, month, year). Is not applicable to the chart type Graphic [Pie 3D].
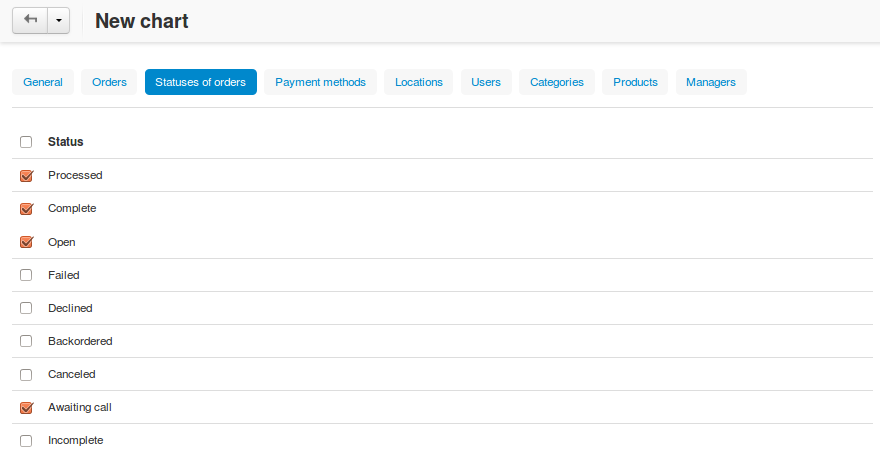
Use the other tabs to filter or limit chart content:
- Orders
- Statuses of orders
- Payment methods
- Locations
- Users
- Categories
- Products
- Managers
For example, the Statuses of orders tab allows you to show statistics on orders with specific statuses only. The Products tab allows you to choose the products, the statistics of which should be represented in the chart. Statistics on the unchosen products will not be included in the chart.
Click the Create button. The new chart will be listed among the other charts.
Questions & Feedback
Have any questions that weren't answered here? Need help with solving a problem in your online store? Want to report a bug in our software? Find out how to contact us.