Debugger
CS-Cart ships with a convenient built-in debugger that lets you easily get access to the profiling, logging, and configuration data.
The debugger can be used to inspect HTTP requests, SQL queries, and template loading behind any page of your storefront or admin panel.
Activate Debug Mode
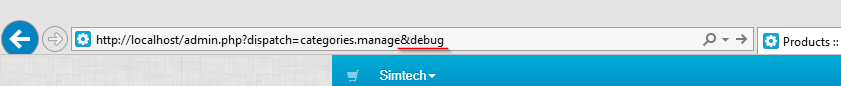
To access the debugger, go to the Administration panel and add the debug parameter to the URL, so that it would look like this:
Note
Using debug will also make the debugger available in the customer area for the current browser session.
The bug icon will appear in the top right corner of the page. Click it to open and close the debugger sidebar. Alternatively, you can hit Ctrl + Alt + D.
To keep the debugger enabled both on the storefront and in the administration panel at all times, define the DEBUG_MODE constant in your config.php or local_conf.php file with the true value:
define('DEBUG_MODE', true);
Warning
Do not use define('DEBUG_MODE', true); on a live store. That way your store visitors may get access to your debug data, which is bad.
Debugger Sidebar
Server
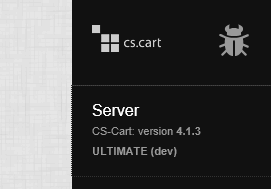
In the Server tab, you will find general system information and information about PHP and PHP modules insalled in the system: versions, paths, config variable values, etc.
Request

In the Request tab, you will see information about the latest HTTP request and the respective server response, as well as cookie values.
Config

Config
Values extracted from the configuration files (config.php and local_conf.php).
Settings
Current settings values extracted from the database (the cscart_settings_* tables).
Runtime
Data related to the currently executed script.
SQL

In this tab, you can see which SQL queries were executed during the page loading with the execution time for each one (Queries list and Queries count).
Also, you can submit custom SQL queries in the Queries parse tab.
Logging

In this tab, you will find data on memory consumption, number of files loaded, SQL queries executed, and time spent on every step of the page loading: before initialization, after initialization, before template loading, and after template loading.
Templates

In the Templates tab, you will find detailed information about the template hierarchy and data behind the page.
You can find the template tree and the list of variables used by every template.
Questions & Feedback
Have any questions that weren't answered here? Need help with solving a problem in your online store? Want to report a bug in our software? Find out how to contact us.